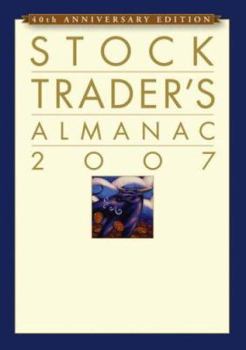
Stock Trader's Almanac
Select Format
Select Condition 
Book Overview
Celebrating forty years of trusted stock guidance Over the past 40 years, The Stock Trader's Almanac has established itself as the only investment tool of its kind that helps traders and investors... This description may be from another edition of this product.
Format:Spiral-bound
Language:English
ISBN:0471783773
ISBN13:9780471783770
Release Date:October 2006
Publisher:John Wiley & Sons
Length:192 Pages
Weight:1.00 lbs.
Dimensions:0.7" x 6.8" x 9.4"
Customer Reviews
5 ratings
best almanac for investors
Published by Thriftbooks.com User , 17 years ago
i have been using this almanac for many many years and i also subscribed to their web services. Just one trade will be worth it. I believe in probability when it comes to the stock market and one should try to line up everything you could to increase your probability of a successful trade or investment. Why not buy or sell with that in mind over and above the tools you use either foundamentals or technical or both.
Industry Standard
Published by Thriftbooks.com User , 17 years ago
As the industry "heavies" go, this publication is definitely a standard. Clearly, every trader knows no one book is the answer-all; and, this annual is definitely worth serious consideration for standard trading watch.
Comprehensive Guide on Stock Market Patterns and Statistics
Published by Thriftbooks.com User , 17 years ago
The average investor probably believes that stock prices are a "random walk" and that no one can benefit from analyzing stock market price history. These investors would be "wrong" as is the case with most of the conventional wisdom on Wall Street. The stock market exhibits many recurrent calendar-based patterns that intelligent investors can use to enhance their personal investment results while decreasing risk. This calendar/organizer/planner is in its 40th edition and the authors have done a masterful job of presenting the information in a useful and easy-to-understand manner. They've provided investors with a complete historical perspective on daily, weekly, monthly, and annual stock market patterns and strategies. There is particularly useful data on how to take advantage of the presidential four-year cycles, the best six months strategy for the DJIA and S & P500, the best eight-month strategy for the NASDAQ Composite, and the strongest and weakest months of the year. Traders, as well as short-term and long-term investors will all benefit from the insights provided in this "gem" of an investment almanac. Traders, in particular, can benefit from the many daily and holiday, and seasonal market patterns occur with a high frequency. Every person who invests in the stock market, without taking into account the vital information in this almanac, should not complain about his or her poor performance. Also included in this almanac are extensive statistics (point moves and percentage moves) on the DJIA by year and month going back at least 50 years. In addition there is information on the 10 best and worst days by percent and points for the DJIA, S & P 500, NASDAQ, Russell 1000 and 2000. Moreover, this data is then replicated for the 10 best and worst weeks, months and years for these same indexes going back to their inception. In summary, the Stock Trader's Almanac is a masterpiece of stock market history that keeps getting better every year. It is an indispensable guide to successful investing. I highly recommend it to all investors and traders.
Stock Traders must have this book!
Published by Thriftbooks.com User , 17 years ago
This book is set up like a journal for taking notes through out the year. It is a quick read if you go straight through. It is meant to be read through out the year giving you an over view of how each month has done in the stock market over the years. It has great inserts of information after each month that explains past patterns like the pre-election years and how they out perform other years (The stock market has been up 68 years straight in a presendential pre-election years 2003,1999,1995,1991 etc.). The best 6 months strategy shows how investing from November 1st-April 30th out performs May 1st-October 31st over the last 55 years. If you invested $10,000 in only Nov-April in this time period you would have had an average return of 7.9% and $544,323, with May-Oct you would have had .3% and only $9,728. It has a great section about seasonal trading which explains what sectors go up and down traditional each year based on their business cycles. Buy this journal and use it if you are a serious trader of stocks. It will make you a lot of money.
Spiral bound history
Published by Thriftbooks.com User , 17 years ago
This book should be part of your due diligence analysis. Almost 200 pages in spiral bound format, it allows you to quickly flip back and forth on specific performances of indexes and stocks. Why would you want past performances? Because you want to have all the information you want before you make a jump on a company. I think this is mainly designed for long-term purposes, as you look for historical analysis and chart trends; however, short-term uses isn't necessarily an impossibility. Overall a good buy! Other investment books to consider: (Investin Without Losin ISBN 0978834607 - NOT on amazn on other stores)


