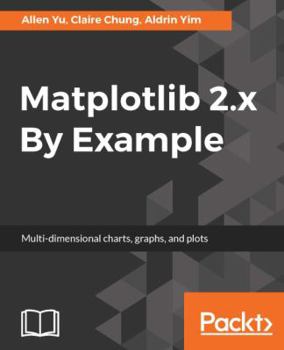
Matplotlib 2.x By Example: Multi-dimensional charts, graphs, and plots in Python
Unlock deeper insights into visualization in form of 2D and 3D graphs using Matplotlib 2.x Key Features
Format:Paperback
Language:English
ISBN:1788295269
ISBN13:9781788295260
Release Date:August 2017
Publisher:Packt Publishing
Length:334 Pages
Weight:1.27 lbs.
Dimensions:0.7" x 7.5" x 9.3"
Customer Reviews
0 rating


