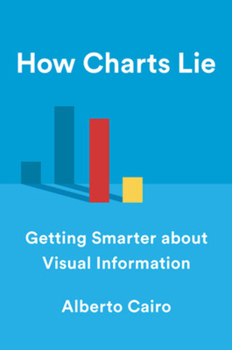
How Charts Lie: Getting Smarter about Visual Information
Select Format
Select Condition 
Book Overview
We've all heard that a picture is worth a thousand words, but what if we don't understand what we're looking at? Social media has made charts, infographics, and diagrams ubiquitous--and easier to share than ever. We associate charts with science and reason; the flashy visuals are both appealing and persuasive. Pie charts, maps, bar and line graphs, and scatter plots (to name a few) can better inform us, revealing patterns and trends hidden behind...
Format:Hardcover
Language:English
ISBN:1324001569
ISBN13:9781324001560
Release Date:October 2019
Publisher:W. W. Norton & Company
Length:256 Pages
Weight:1.14 lbs.
Dimensions:1.0" x 6.4" x 9.4"
Customer Reviews
0 rating


