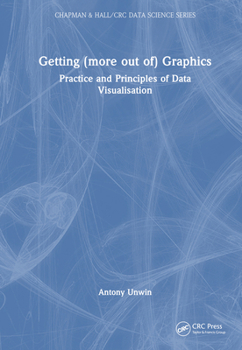
Getting (more out of) Graphics: Practice and Principles of Data Visualisation
This book presents a practical approach to graphic data analysis with real applications front and centre. A knowledge of Statistics is not required, just an interest in data graphics and some experience of working with data.
Format:Hardcover
Language:English
ISBN:0367674009
ISBN13:9780367674007
Release Date:September 2024
Publisher:CRC Press
Length:432 Pages
Weight:2.18 lbs.
Dimensions:1.0" x 7.0" x 10.0"
Customer Reviews
0 rating


